
Bitcoin hit the level that's marked every bottom
But should we still wait?

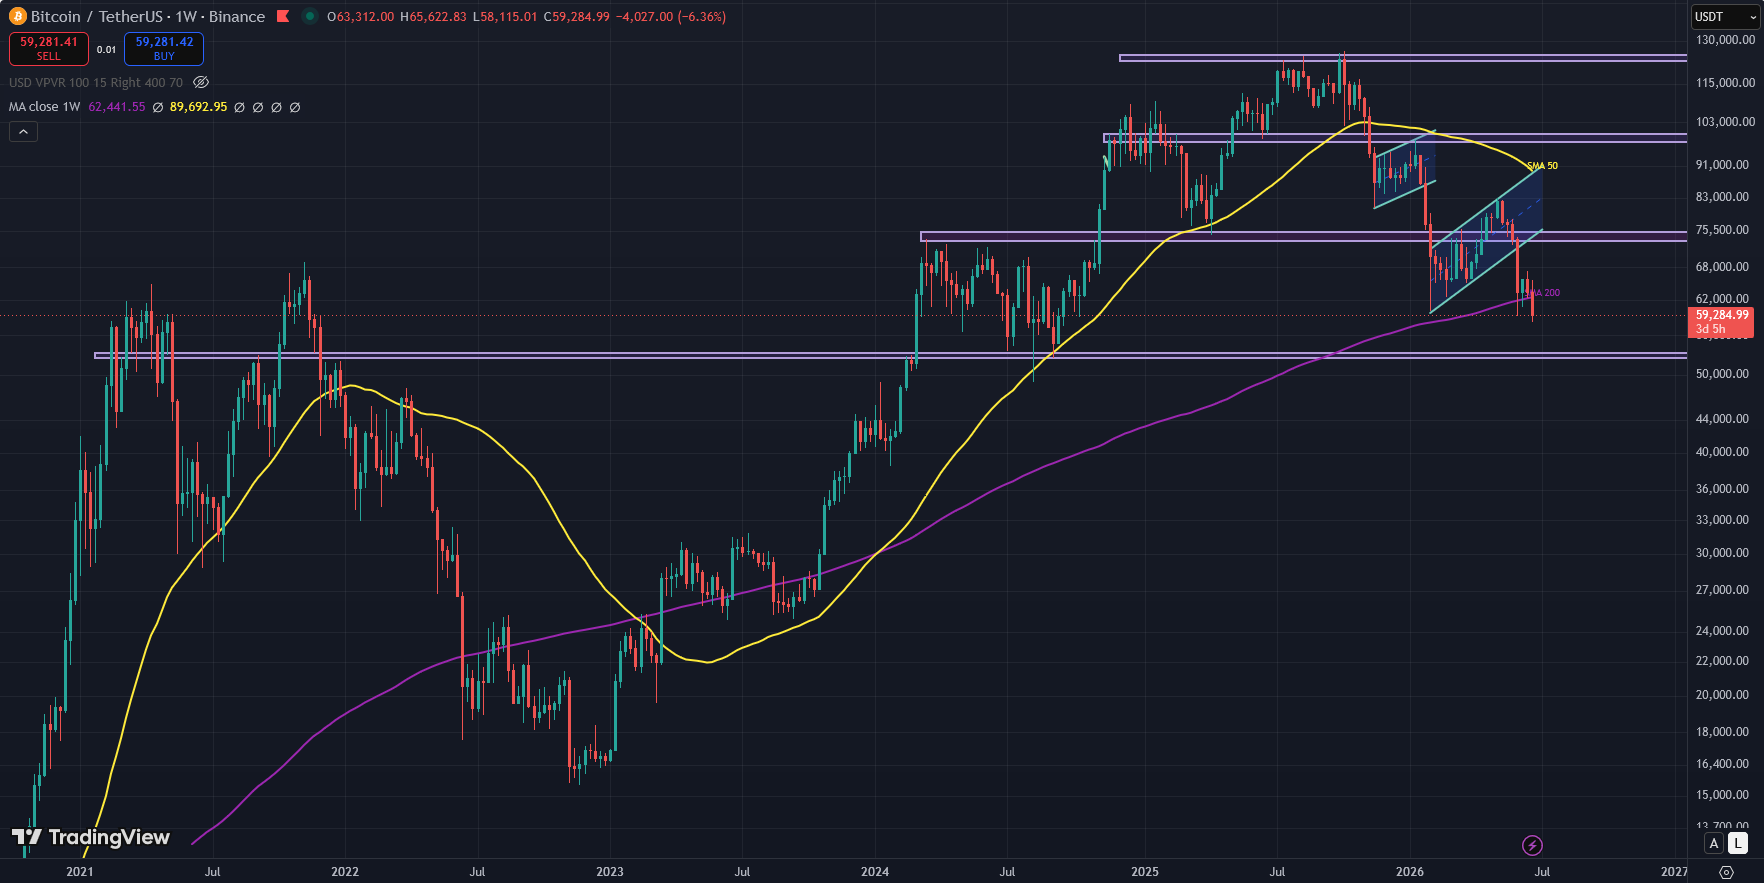
Sometime in the last twenty-four hours Bitcoin slipped under its 200-week moving average and kept falling, printing an intraday low around $58,100 — its weakest level since September 2024 — before crawling back into the high $58s. If that line on the chart means nothing to you, here is why it should mean something.
The 200-week moving average is the slowest, dumbest, most reliable signal in all of crypto. It is just the average closing price over the last four years, and Bitcoin has spent almost its entire existence trading above it. The asset has only broken below that line a handful of times in its history:
the floor of the 2018 bear market,
the March 2020 Covid liquidity crash,
and the smoking crater that FTX left behind in late 2022.
In hindsight, every single one of those moments was the best entry of its cycle. Which is why the chart that has been flying around X all day carries one loud, simple message: this is the bottom, buy with both hands.
I want that to be true. I also think the people posting it are quietly skipping the part that actually decides whether they’re right.
Here it is. That “never failed” track record is four data points. All four happened while the Federal Reserve was either cutting rates or about to.
December 2018 came right before Powell pivoted dovish.
March 2020 was zero rates and the money printer running hot.
The 2022 bottom formed as the market started pricing the end of the hiking cycle.
The 200-week line didn’t hold because of magic. It held because every time Bitcoin kissed it, a wave of cheap money was already on its way to lift everything that had been beaten down. This time, that wave is nowhere on the horizon.
The PCE inflation print came in at 4.1%, the hottest reading since 2023.
Rate cuts aren’t getting delayed — they’re getting buried.
The Fed is sitting at 3.50–3.75% with no intention of moving,
oil is camped near $100 because of the Iran situation,
and the liquidity backdrop that rescued Bitcoin from this exact line four times running simply does not exist right now.
The chart is telling you to buy. The macro is telling you the chart has never been tested in conditions like these.
So the more honest question isn’t whether the line holds. It’s who is leaning on it, and why they’re selling. There are three forces dragging this market down, and once you see all three clearly, the “obvious bottom” starts looking a lot more like the middle of something.
The first force is the people who were supposed to be Bitcoin’s permanent bid.
US spot Bitcoin ETFs just bled $6.4 billion over thirty days — the largest 30-day outflow on record, worse than anything we saw during the FTX collapse. These products were sold to a brand-new class of investor as digital gold that only goes up, a clean ticker you could buy in a brokerage account and forget about. A lot of those buyers are BlackRock and Fidelity clients who came in near the top, watched the thing cut in half, and are now finding out what they actually own.
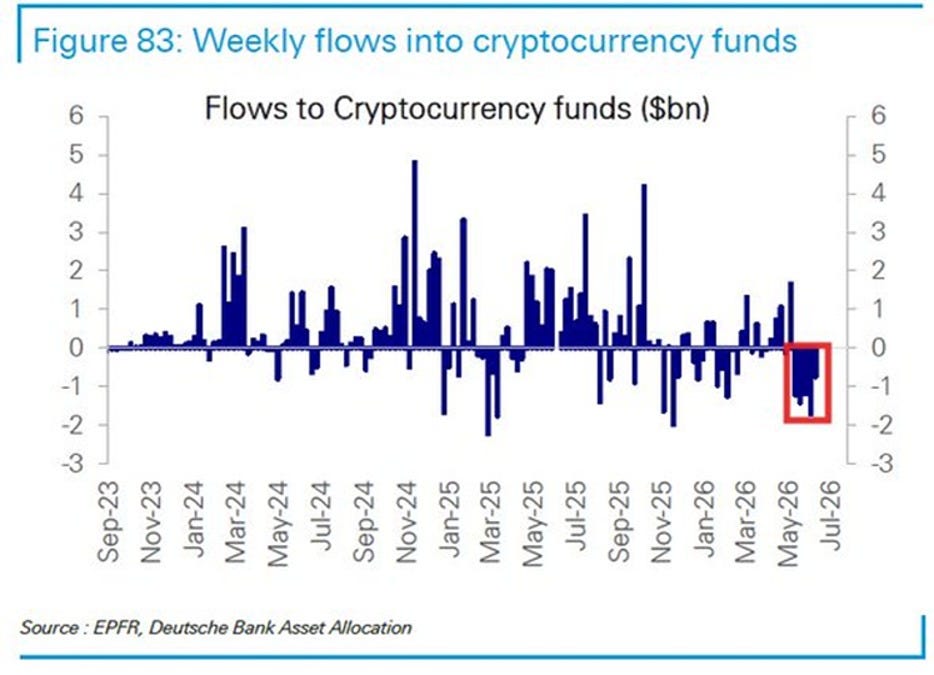
Twelve-month cumulative inflows into crypto funds have collapsed to about $5 billion, down from the $10 billion peak last October, and as a share of assets under management they’ve fallen to roughly 7% from 16% in April. That is not a dip being bought. That is the marginal institutional buyer turning into the marginal institutional seller, and they are doing it for the least sophisticated reason there is: the number went down and they got scared.
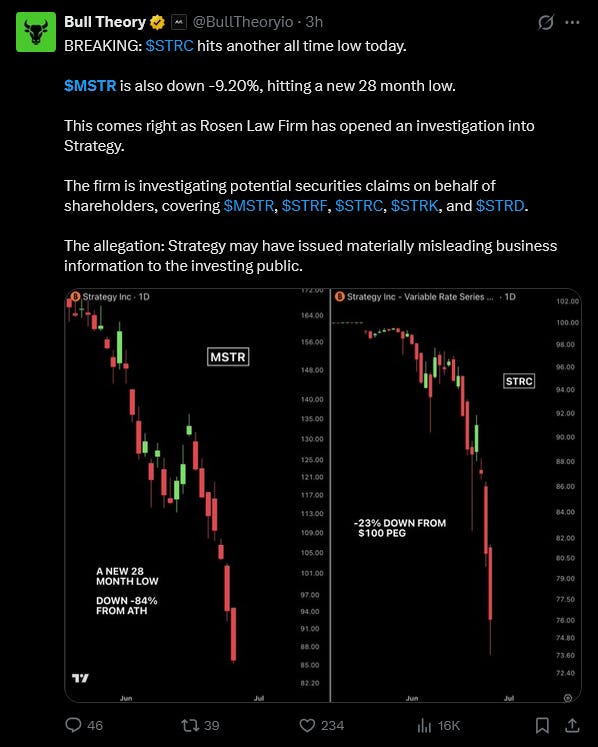
The second force is the one that deserves the most attention, because it’s the one that’s genuinely new since the last time we talked about it. Michael Saylor’s Strategy is starting to come apart at the seams it always denied having.
MSTR common stock fell below $100 for the first time since 2024 this week, hit a 52-week low around $86, and now sits down roughly 84% from its all-time high. But the common stock isn’t the tell. The tell is STRC — the variable-rate preferred Saylor marketed to retail as a high-yield, low-drama income vehicle with a “better Sharpe ratio than the best hedge funds.” STRC was engineered to trade around its $100 par value. This week it broke to about $73, roughly a quarter below the price it was designed to hold. Strategy’s entire money machine runs on issuing these securities at or above par to fund Bitcoin purchases. When STRC trades this far under par, that funding channel jams. The buying engine that defined this entire cycle stalls out.
And the meter is still running on the other side. Strategy owes around $1.2 billion a year in dividends on its preferred stack, against a cash reserve it last disclosed at roughly $1.4 billion. Coverage that used to be measured in years is now measured at about fourteen months. The 11.5% dividend on STRC ratchets higher the further the price falls from par, which means the cheaper it gets, the more expensive it becomes to service — a feedback loop pointing in exactly the wrong direction.
Roughly 80% of STRC is held by retail. So the people eating the losses on Saylor’s “low-volatility income” product are the same small investors who trusted the pitch. On Wednesday, Rosen Law Firm announced it’s investigating whether Strategy issued materially misleading information to the public, covering the common stock and all four preferred series. Peter Schiff, never one to miss a victory lap, declared that MSTR’s death spiral had finally pricked the Bitcoin bubble.
Here’s where I’d push back on my own bearishness, because the death-spiral framing is being thrown around carelessly. Strategy is not Terra Luna. There is no code that force-liquidates Saylor if STRC drops; the preferred dividends are discretionary, declared at the board’s pleasure, and he can simply choose not to defend the price. He won’t get margin-called into oblivion. What he will get is a confidence crisis — a slow strangling of his ability to raise new money, which is a very different and slower death than the one Schiff is selling. But the market isn’t pricing the mechanics. It’s pricing the fear that the largest single owner of Bitcoin, a man whose whole identity is “we never sell,” might be cornered into selling a meaningful clip just to shore up his balance sheet and prove to shareholders the common stock is safe. He probably wouldn’t even move the price much by doing it — his hundred-million-dollar buys stopped moving Bitcoin up months ago. The damage would be entirely narrative. And narrative is exactly what crashes a market that’s already running on fear.
The third force is the one everyone was counting on to save them, now flipped into the thing dragging them down: regulation.
For over a year, “the CLARITY Act is coming” was the bull case you could text to your skeptical friends. The House passed it almost a year ago. Real American rules for digital assets, finally. That promise pulled a lot of money in. It’s now pushing that same money back out, because the buyers who came for regulatory certainty are watching the clock run out. The Senate adjourned today for nineteen days. Senator Lummis is promising final bill text around July 4 and a floor push in July, but the bill is still wedged behind a conflict-of-interest fight tied to the President’s own crypto holdings, an unresolved DeFi section, and a stablecoin-yield loophole the banks are fighting hard to keep closed. Galaxy already cut its odds of passage this year to 60%, citing the shrinking calendar before the August recess. The net buyers who bought a catalyst are becoming net sellers of a delay. Same emotional reflex as the ETF crowd, different excuse.
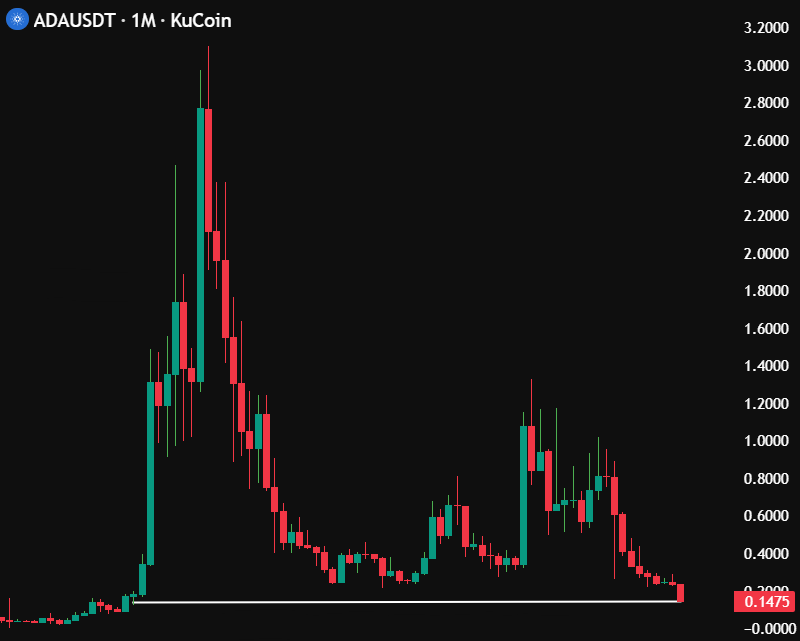
And then there’s the texture of all this — the small, ugly stuff that only happens at the bottom of cycles, when nothing works and everyone is exhausted. Cardano holders just got robbed, and not through some sketchy DeFi farm.
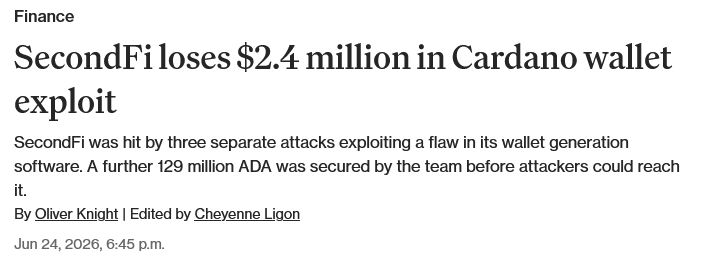
SecondFi, the wallet formerly known as Yoroi and built by EMURGO — one of the three founding entities of Cardano itself — disclosed that a flaw in its web wallet generation software exposed users’ private keys. Around 178 wallets were drained of roughly 16 million ADA, about $2.4 million, plus tokens and NFTs. Security firm SlowMist thinks the real exposure could top $20 million across as many as 129 million ADA. Read that again: the keys weren’t lost to a phishing link or a careless seed phrase. They were compromised by the wallet’s own infrastructure, built by a pillar of the ecosystem.
ADA is sitting at fifteen cents, its lowest since 2020, and has dropped out of the top twenty. Charles Hoskinson’s response was that the dollar amount was modest by crypto-hack standards but that this “brings no solace” to people who lost everything they held. He’s right on both counts, and the coldness of being right is its own little portrait of where we are. This is what capitulation actually feels like up close. Not just price — trust, leaking out of the floor.
So where does that leave the person staring at the 200-week line wondering whether to buy?
Start with the downside, honestly.
A normal Bitcoin bear market doesn’t stop at down 54%, which is where we are now from the $126,000 top. Normal is 70% to 75%. Run that math from the all-time high and you land somewhere around $36,000, with a worst case in the low $30,000s. That’s not a doom fantasy — that is simply what an average Bitcoin bear has done every previous time. The one argument against it is that this top wasn’t built on euphoria. We didn’t blow off in a mania; we ground sideways and rolled over in apathy, which historically means less air to let out. Maybe that spares us the full 70%. Maybe it doesn’t.
What I’m not going to do is tell you this is a clean back-up-the-truck moment, because the honest read is messier than the chart wants it to be. The bull case is real and it hasn’t changed: there are still only ever going to be 21 million Bitcoin, none of this week’s news touched that, and the iron law of every bottom is that it forms precisely when the biggest buyers turn into forced sellers — which is happening across all three forces right now. That’s not a coincidence; that’s what the bottoming process looks like. But “looks like a bottom” and “is the bottom this week” are not the same sentence, and 2022 should have taught everyone that the 200-week line can hold you underwater for sixteen months before it pays off.
The level to actually watch is the weekly close. The 200-week average sits around $62,000. If Bitcoin can close the week back above it, you get a higher high and a real signal that this break was a flush, not a trend. If it closes the week below, you have the 2022 setup — a failed reclaim followed by another leg down — and the people telling you to catch the knife will go quiet. Everything between here and that close is probability, not prophecy.
The chart says generational opportunity.
The macro says you’d be the first person in Bitcoin’s history to buy this line without the Fed at your back.
Both of those things are true at the same time, and anyone selling you only one of them is selling you something. The only question worth answering before you put money in is whether you can be wrong for a year and a half — in a macro that’s actively working against you — and still hold.
If the answer is yes, the next three to six months are where fortunes in this asset have always been made. If the answer is no, “buy the 200-week” was never advice meant for you.
— A.Z., Freedom Finance
*None of this is financial advice. It’s analysis. Do your own research, size your positions to what you can genuinely afford to lose, and don’t make decisions based on price targets from anyone — including us.
P.S. I put together a mini-book on the #1 thing that wrecks altcoin investors — timing.
It’s called “The Altcoin Season Playbook.”
Inside: the 5 repeatable signals that show when altseason is starting, when it’s ending, and when you’re about to become someone else’s exit liquidity.
It’s practical — rotation maps, entry/exit checklists, and the same red-flag indicators that have flashed at the top of every cycle.