
Why is Everything Pumping Except Crypto?
And What Happens When That Changes

What Happened This Week
At some point this week, someone put up a chart comparing Bitcoin’s performance to every other major asset since October 2025. Bitcoin is down nearly 40%. The KOSPI is up 127%. Silver is up 58%. The Nasdaq is up 21%. Gold is up 13%. The S&P 500 just logged its ninth consecutive week of gains — its longest winning streak in three years — up 16% across April and May alone, one of its three best two-month stretches this century. And Bitcoin, the asset that was supposed to be the hardest, scarcest money ever created, is the single worst performer in the entire comparison. Not the second worst. Dead last.
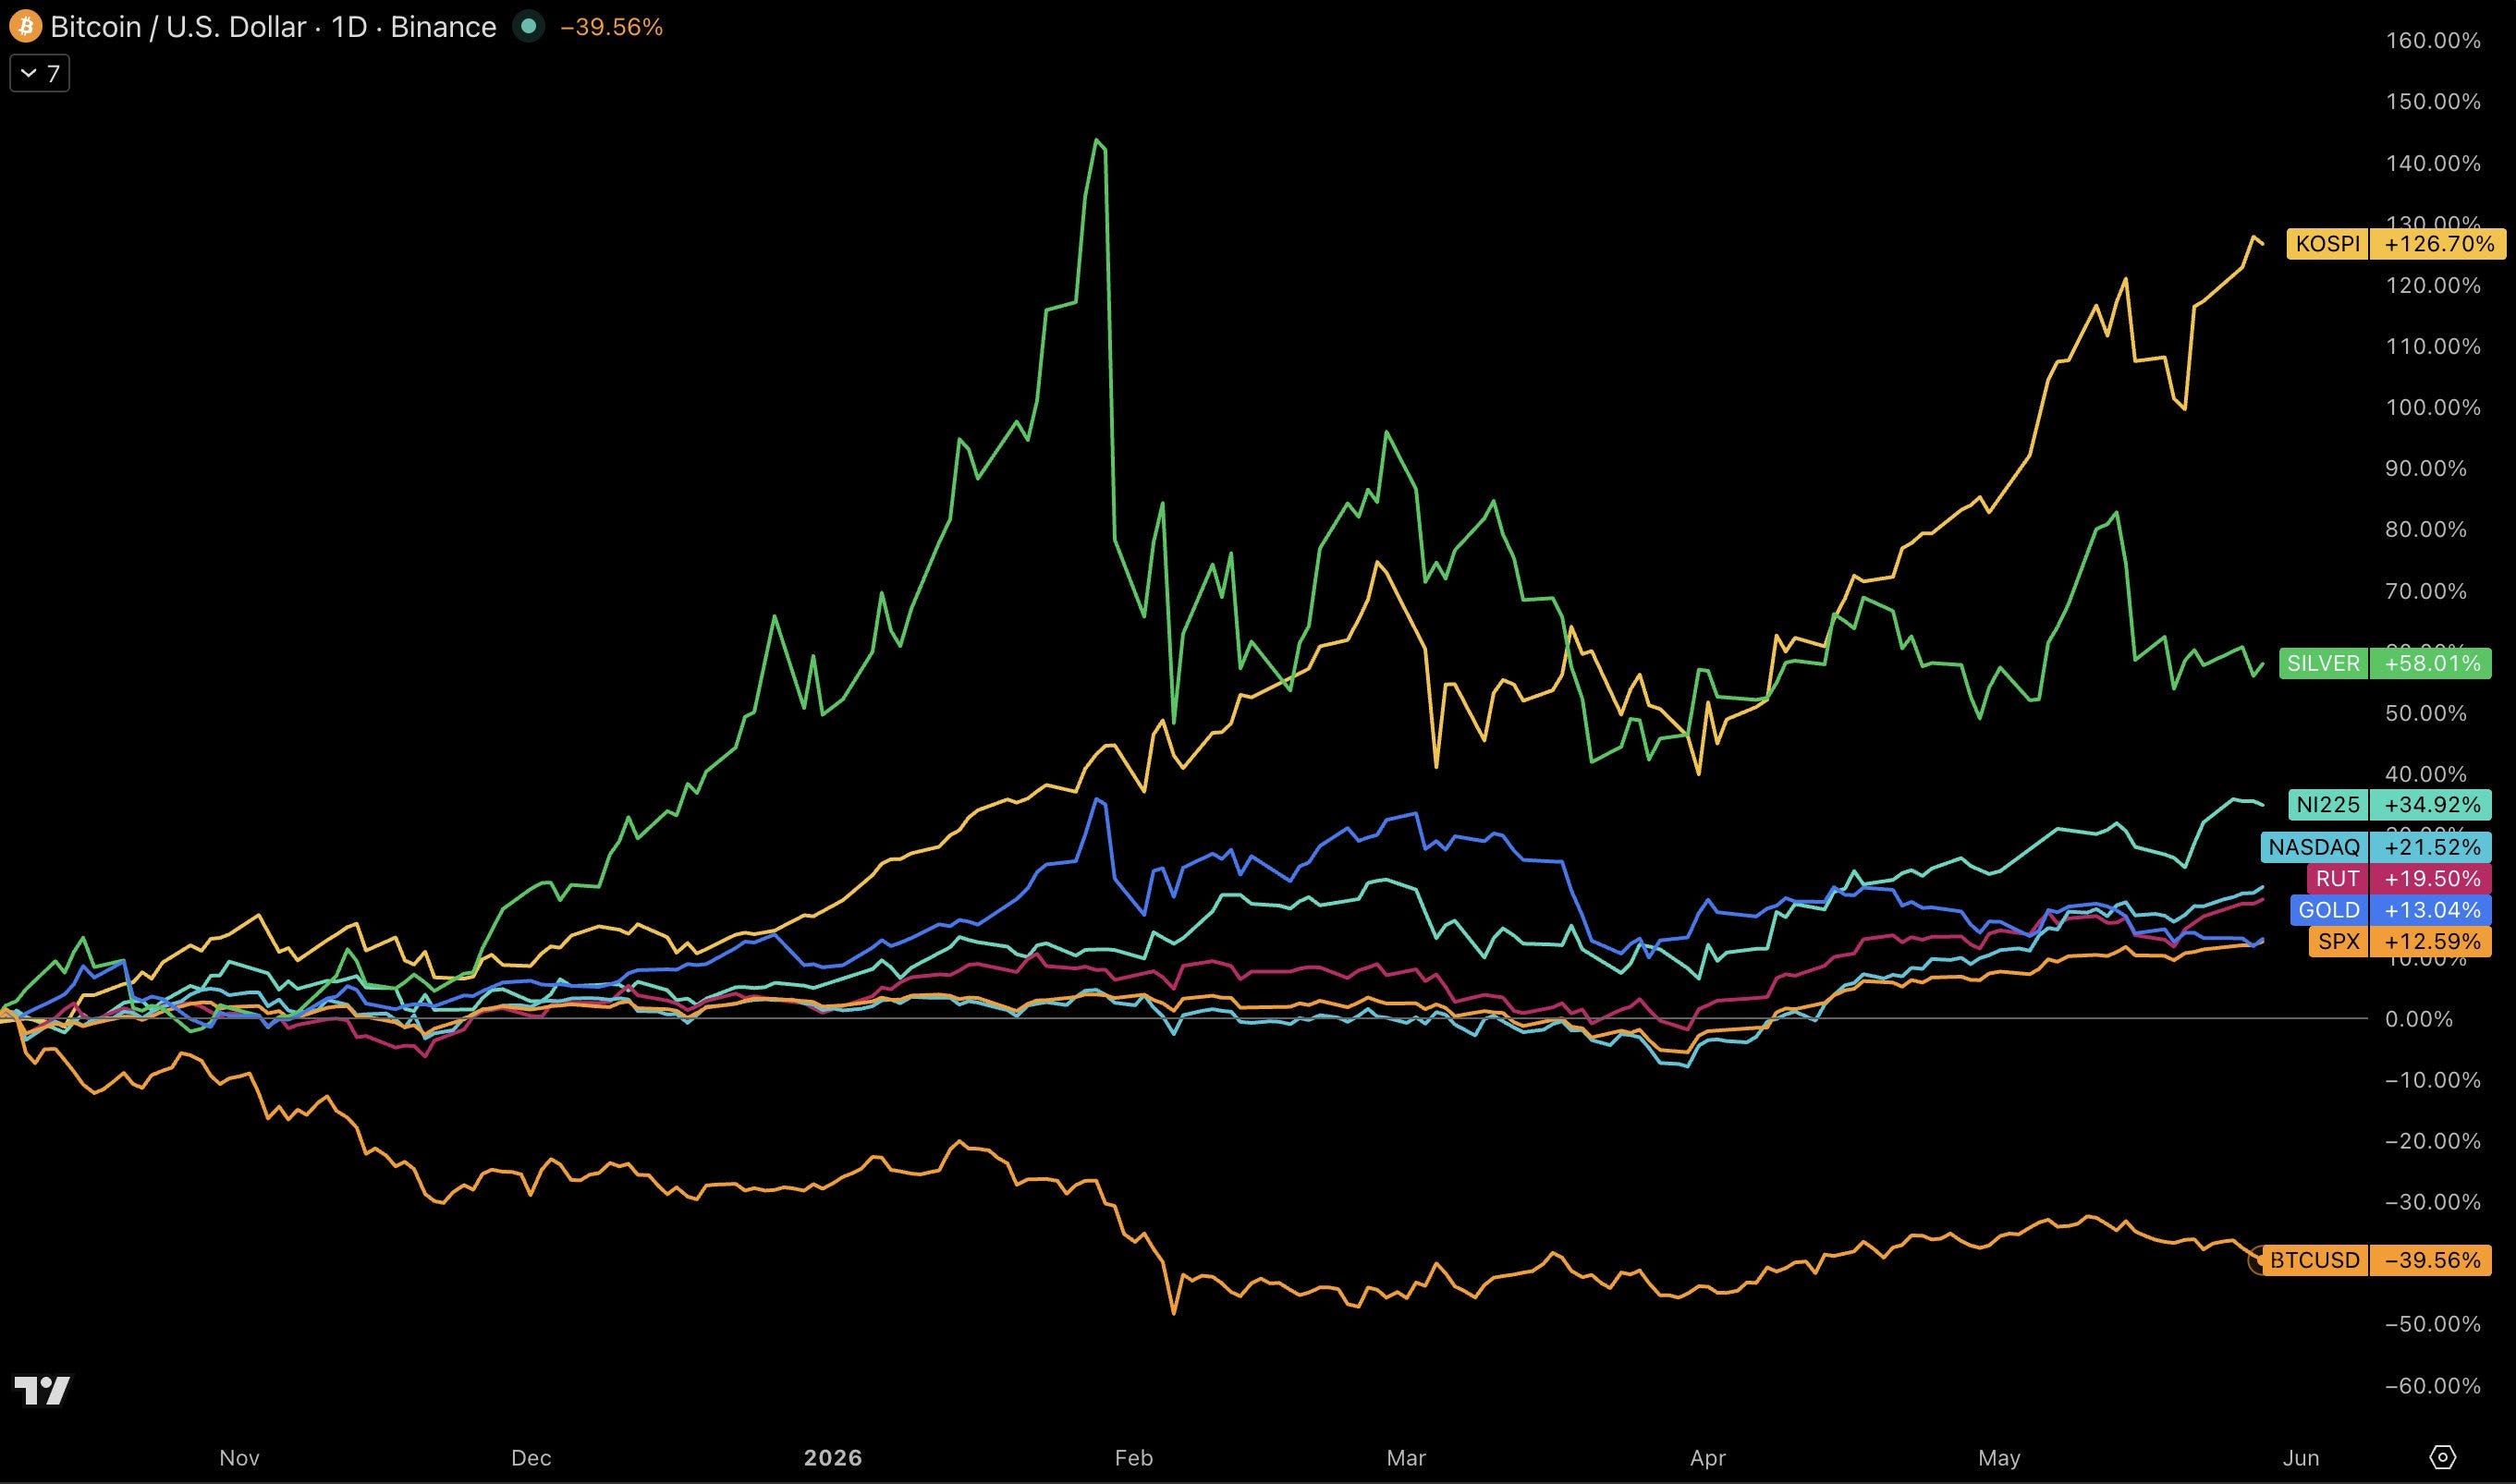
That chart is the context for everything else that happened this week, and pretending otherwise wouldn’t be honest.
On Wednesday, the US struck an Iranian military site near the Strait of Hormuz, shooting down Iranian attack drones and triggering a wave of roughly $1 billion in crypto liquidations in a matter of hours — 93% of which were long positions. Bitcoin dropped below $73,000 for the first time in months. Then US and Iranian negotiators drafted a 60-day ceasefire extension memorandum, stocks rallied, oil continued falling off a cliff — Brent crude is now down nearly 20% from its 2026 peaks at around $92 — and Bitcoin barely moved. The equity markets celebrated and crypto stood in the corner not getting the memo.
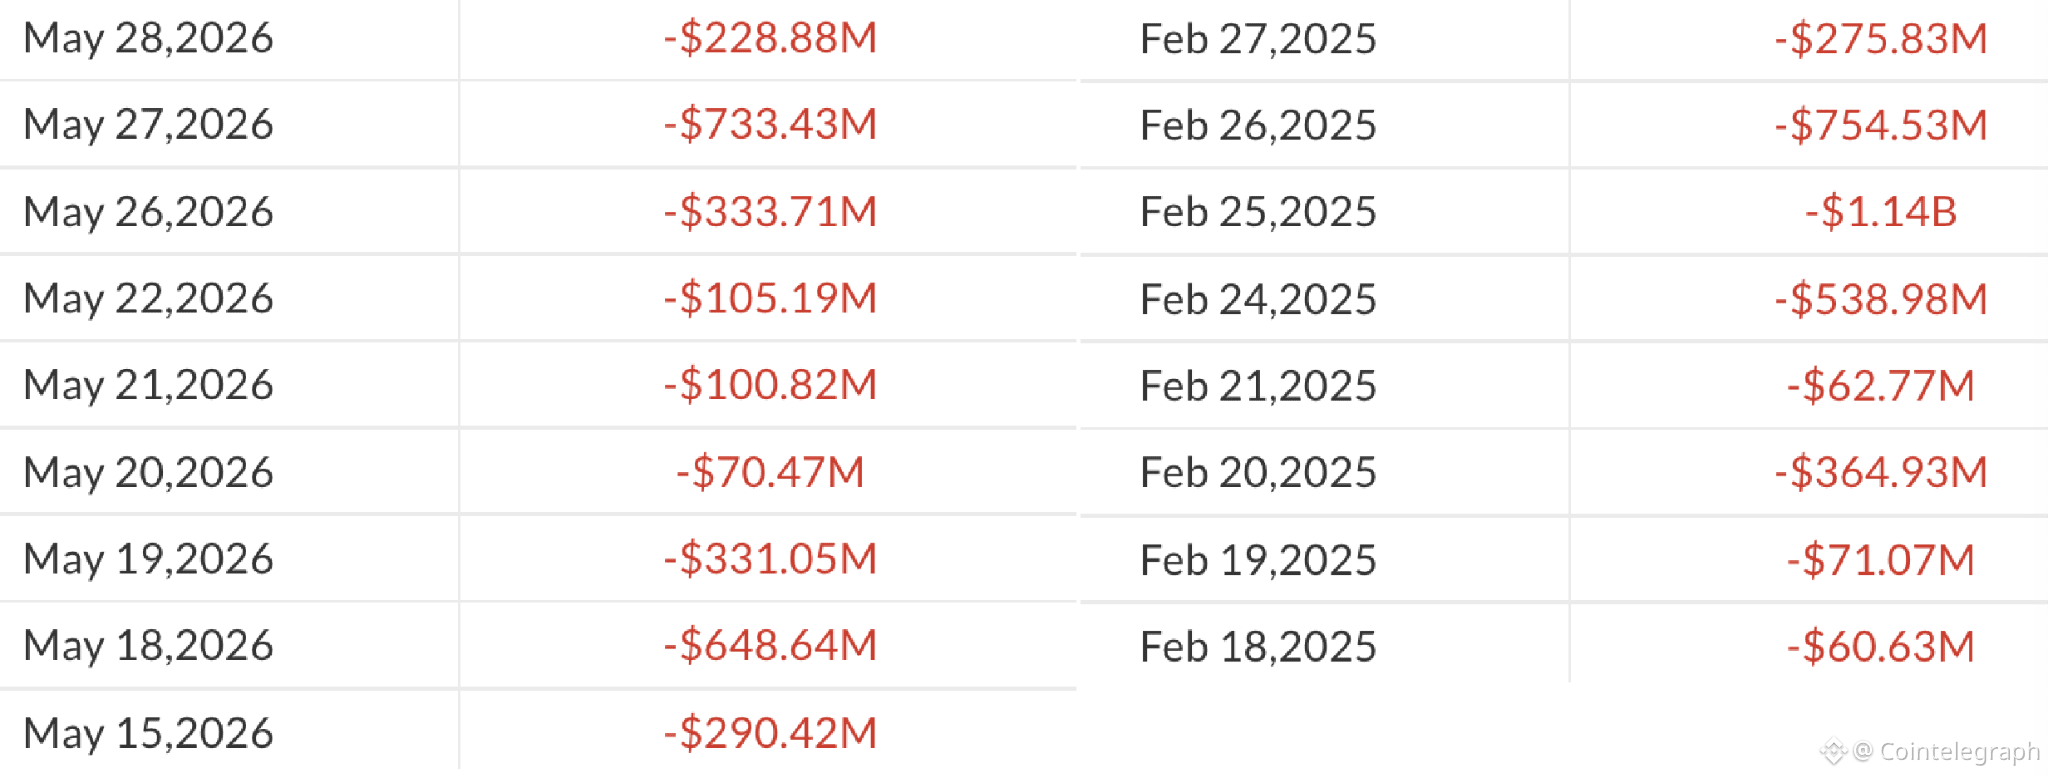
The ETF data got worse. Nine consecutive days of net outflows from US spot Bitcoin ETFs — the longest streak since these products launched in January 2024 — totaling $2.8 billion pulled from the market. BlackRock’s IBIT recorded its second-largest single-day outflow in history at $527 million on May 27. A $1.3 billion dark pool block sale of IBIT was reported the same day. Year-to-date net inflows, which were nearly $4 billion at their peak, have been ground down to around $536 million. The institutional bid that drove the 2025 rally is, at minimum, on pause.
Strategy moved 441 Bitcoin to Coinbase Prime. On the face of it, that is a $30 million transfer from a company holding $61 billion in Bitcoin. The market reacted like it was a five-alarm fire. Polymarket odds of Strategy selling some of its holdings before end of June spiked to 84% within hours, then fell back to 23% when they pulled the coins back. The sensitivity of that reaction tells you everything about where confidence is right now. For context: Strategy’s average purchase price is $75,537 per coin. Bitcoin is at $73,000 to $74,000. They are underwater on the entire treasury.
On the other side of the ledger, Vivek Ramaswamy’s Strive raised $194 million in a single week through its SATA preferred stock structure and bought approximately 2,624 Bitcoin — a record week for the company. They now hold 16,500 BTC, no debt, no encumbered coins, ahead of both Coinbase and Riot Platforms on the corporate holder rankings. Someone is buying this dip aggressively, just not through the ETF wrapper everyone watches.
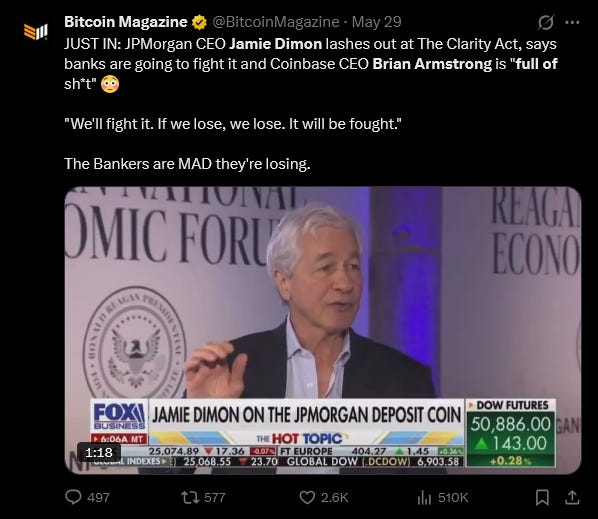
In Washington, the CLARITY Act drama continued. Jamie Dimon appeared at the Reagan National Economic Forum and very publicly declared war on the bill — complaining it allows stablecoins to pay interest without proper consumer protection and lacks meaningful AML provisions. He said: “It will be fought. If we lose, we lose and we’ll live.” The Senate Banking Committee passed the bill 15-9. The Senate floor vote window is now June to July. The two Agriculture and Banking Committee versions still need to be reconciled before a unified bill can go to the floor. Treasury Secretary Scott Bessant went on television urging Congress to get it done. SEC Chair Paul Atkins said he has full confidence Congress will adopt the CLARITY Act and send it to the president’s desk.

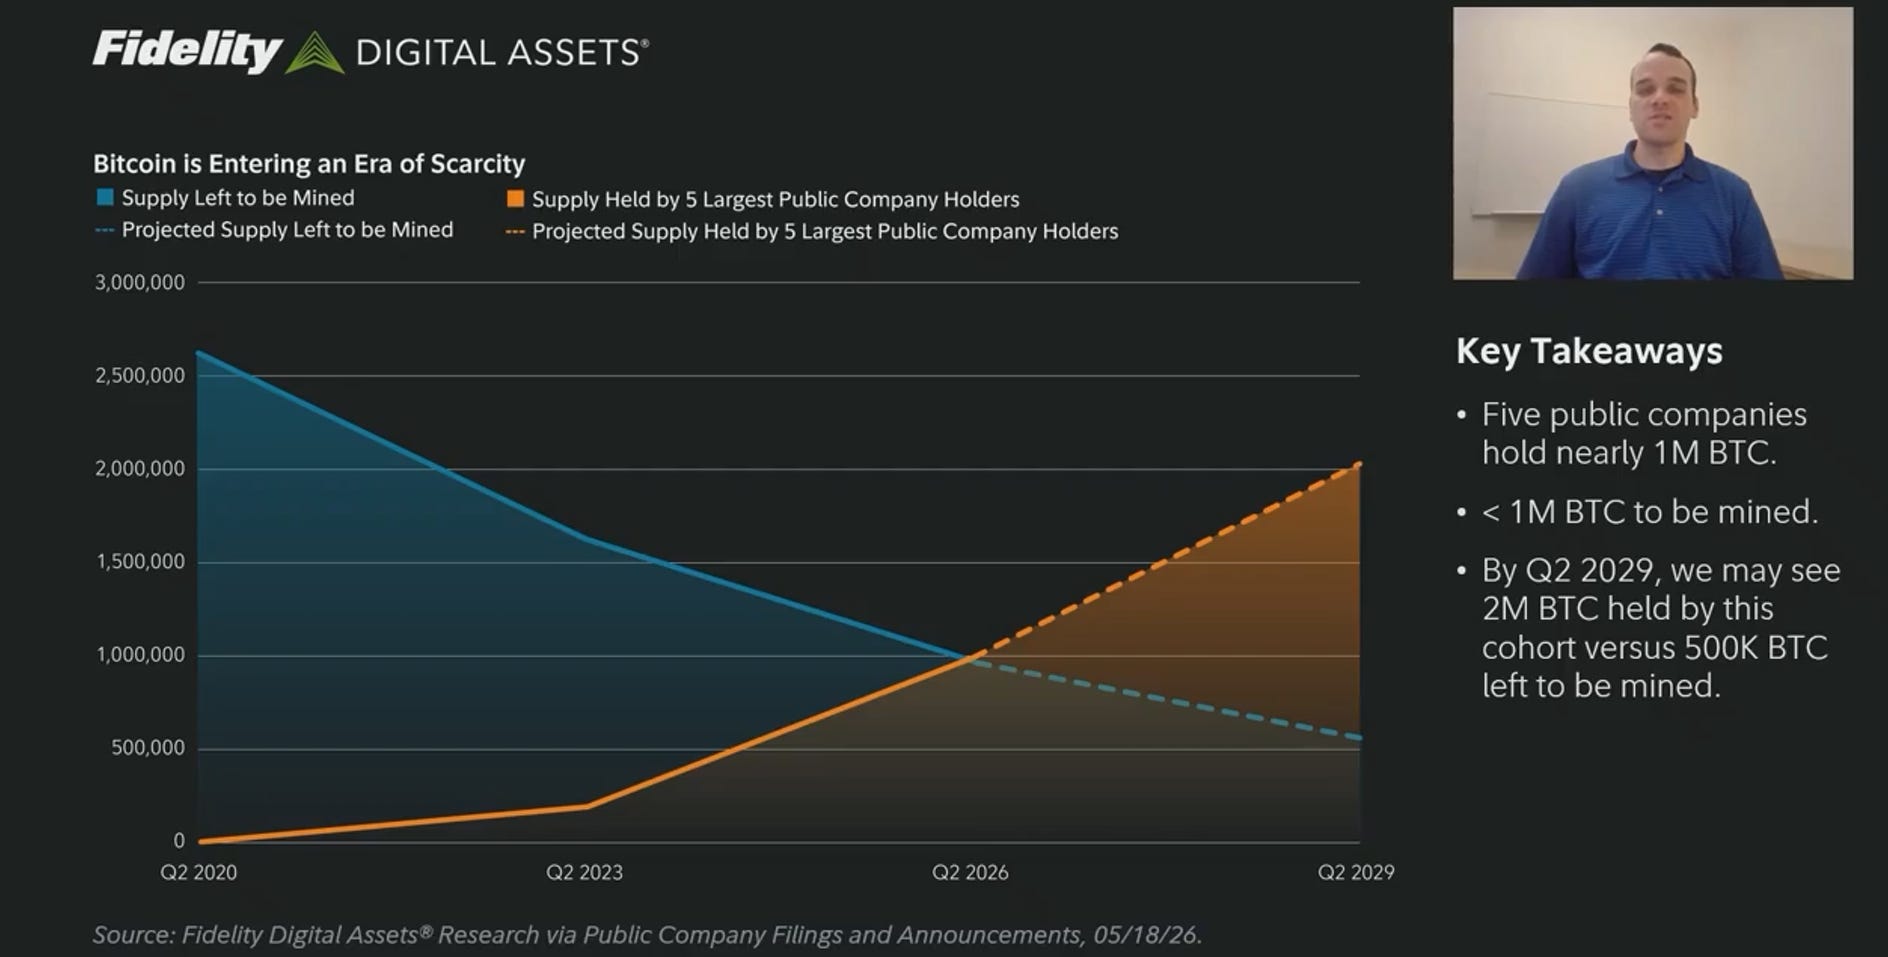
One structural story that got buried under everything else: SoFi launched SoFi USD on Ethereum — the first stablecoin issued by a US nationally chartered bank. And Fidelity Digital Assets published research showing that five public companies now collectively hold nearly 1 million Bitcoin, while fewer than 1 million Bitcoin remain to be mined. By Q2 2029, their projections show those five companies alone could hold 2 million BTC versus approximately 500,000 left to mine. The supply math is changing faster than the price suggests.
Bitcoin dominance is currently ranging between 59.8% and 60%, having just rejected from a major descending resistance line at around 65.4%. Every other time in history that dominance has hit that resistance and turned lower, altcoins followed with significant runs.
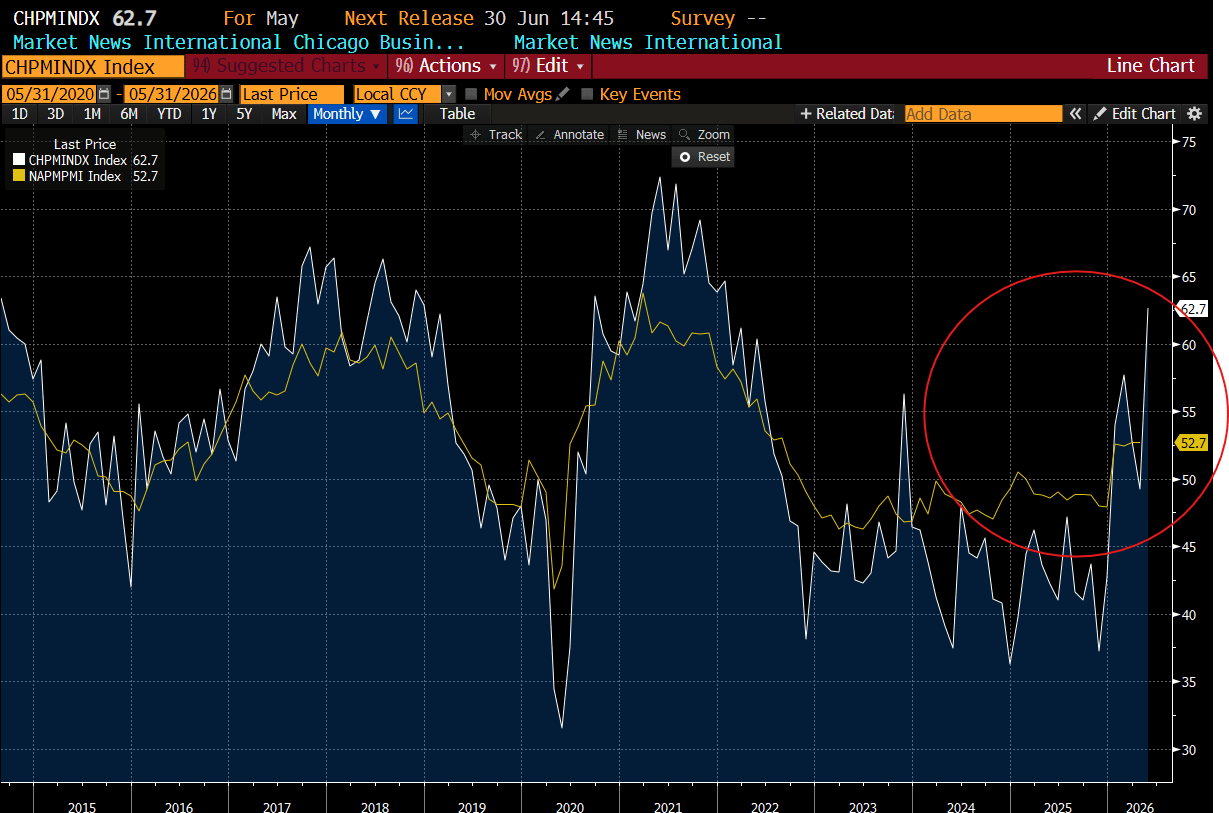
Chicago PMI came in at 62.7 on May 31, well above expectations, with the NAPM reading at 52.7 — both screaming higher after a prolonged trough. The macro engine underneath the surface is doing something different from what the crypto fear index at 28 would suggest.
Where Are We
The honest version of where we are is this: Bitcoin is having its most structurally bullish period in years during the worst price performance of its recent history. Those two things are not as contradictory as they feel.
Start with the performance chart. Bitcoin is the worst-performing major asset since October 2025 by a margin that would embarrass almost anything. And there is one primary reason for that: October 10th, 2025 was the day something broke. A single-day crash from $122,000 to $105,000, liquidating over $19 billion in leveraged positions, created a wave of forced selling that has never fully cleared.
What you are looking at in 2026 is not a normal correction from a macro peak — it is the aftermath of a leverage explosion that happened to coincide with every other risk asset recovering hard.
AI stocks went vertical.
Korean equities went vertical.
Silver went vertical.
Bitcoin was stuck digesting the wreckage of its own leverage.
That framing actually important because it changes what comes next. The analogy is not pretty, but it is apt: this looks a lot like the second half of 2018 going into 2019.
Absolutely awful sentiment.
Everyone waiting for one more leg lower.
Most people having given up on the cycle entirely.
Then a long period of grinding sideways that most people misread as the bottom already being in, before an actual flush, and then a multi-month accumulation that nobody had the stomach to hold through. The question now is whether we are in the grind or approaching the flush. Nobody knows the answer to that, and anybody claiming otherwise is selling something.
What we do know is that the thesis has never been stronger. Fidelity just published data showing that five companies are about to hold more Bitcoin than the entire remaining mineable supply. Five companies. Think about what that sentence means for the marginal buyer. The supply that exists to be sold is already measured in hundreds of thousands of coins. The supply being locked away in corporate treasuries — Saylor’s 818,000 BTC alone — is not coming back to market.
Strategy is not selling. Strive is buying 2,600 coins in a single week. Saylor himself said this week his company will probably purchase all the Bitcoin produced by miners between now and 2140. He said that. Out loud. The man who the market thinks might sell is the one talking about buying Bitcoin until the last coin is mined. Whether you find that inspiring or unhinged depends entirely on your time horizon.
The CLARITY Act situation is where intellectual honesty requires holding two things at once. Jamie Dimon fighting this bill as publicly and as aggressively as he did this week is, counterintuitively, one of the most bullish signals the crypto market has received all year. The biggest lobbying apparatus in American banking is not spending hundreds of millions of dollars in Washington trying to kill a bill that doesn’t matter. When the largest financial institution on earth treats crypto market structure legislation as an existential threat, it means the bill threatens their business model. Which means the bill works.
The Coinbase executive who testified about it put it well: the US has never passed proactive market structure legislation for a new asset class before a catastrophic crisis. They usually do it after the crisis. The fact that this bill exists at all, with bipartisan support and the backing of the SEC chair, the Treasury secretary, and the White House, is something that would have sounded like fantasy in 2022. June is the window. If it doesn’t happen in June, the next realistic shot is after midterms, and that’s a long wait.
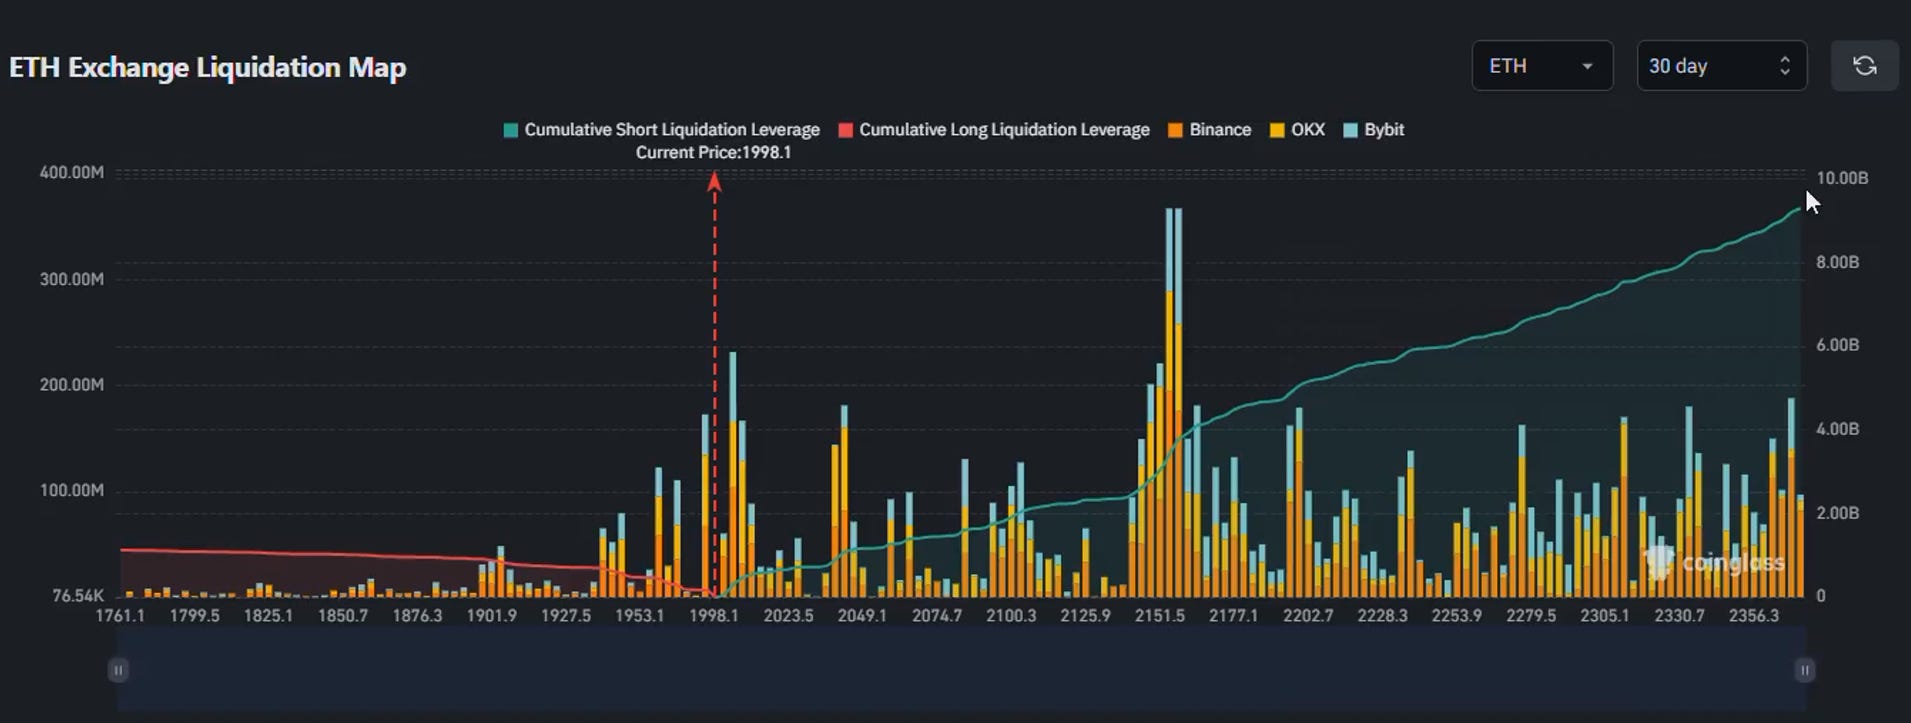
There are two other things worth sitting with. The first is Bitcoin dominance breaking down from that 65.4% resistance. Every prior time dominance rejected from that descending trendline going back to 2016, what followed was a rotation of capital into altcoins. The ETH liquidation map right now shows $10 billion in cumulative short leverage stacked above $2,000, with the biggest cluster sitting around $2,050 to $2,150. That is a coiled spring. ETH has been in a multi-year accumulation box on the weekly chart that has only existed twice before in its history — once in 2016, once in 2019. Both times it eventually broke upward by multiples. The RSI is at historically compressed levels. There are 9 times more ETH shorts than longs right now.
The former head of digital assets at BlackRock said on camera that ETH is winning by a large margin across every metric that actually matters for institutional adoption — 50% of global stablecoin value settled on Ethereum, 70% of tokenized assets in its ecosystem — while the price looks like a dying asset. That gap between narrative and reality is where money is made, eventually.
The second is the Chicago PMI reading. It came in at 62.7 this week, with NAPM at 52.7. Both are surging sharply after years below the expansionary threshold. When business activity accelerates like this, it historically feeds into broader risk appetite over a 2-3 month lag. Oil is down 20% from its highs. If the Iran ceasefire MOU actually holds, the primary argument for a Fed rate hike evaporates. Jordi Visser’s negative real yields thesis — where Bitcoin does all of its real work — becomes more relevant by the week as the debt burden makes meaningful rate hikes structurally impossible. The macro setup is improving exactly when sentiment is worst.
We are not going to pretend the price action isn’t painful. It is. Being down 40% from an all-time high while watching everything else print records is not fun to experience and not easy to rationalize. But there is a difference between a broken thesis and a delayed one.
The corporate accumulation is real.
The legislative momentum is real.
The supply math is real.
The dominance cycle is real.
The ETH liquidation setup is real.
None of these things come with a date attached. They will resolve when they resolve, and the people who will benefit most are the ones who understood what they were holding before the price confirmed it.
June will tell us a lot.
— A.Z., Freedom Finance
*None of this is financial advice. It’s analysis. Do your own research, size your positions to what you can genuinely afford to lose, and don’t make decisions based on price targets from anyone — including us.
P.S. I put together a mini-book on the #1 thing that wrecks altcoin investors — timing.
It’s called “The Altcoin Season Playbook.”
Inside: the 5 repeatable signals that show when altseason is starting, when it’s ending, and when you’re about to become someone else’s exit liquidity.
It’s practical — rotation maps, entry/exit checklists, and the same red-flag indicators that have flashed at the top of every cycle.